History and Logs
When you debug a Chatflow or Workflow, Dify automatically records detailed logs — both at the run level and for individual nodes. These logs make it easier to locate issues, understand how data flows through your workflow, and fine-tune performance.
To explore logs from real users after your application is published, check out Logs and Annotation.
There are two dimensions of execution records for applications.
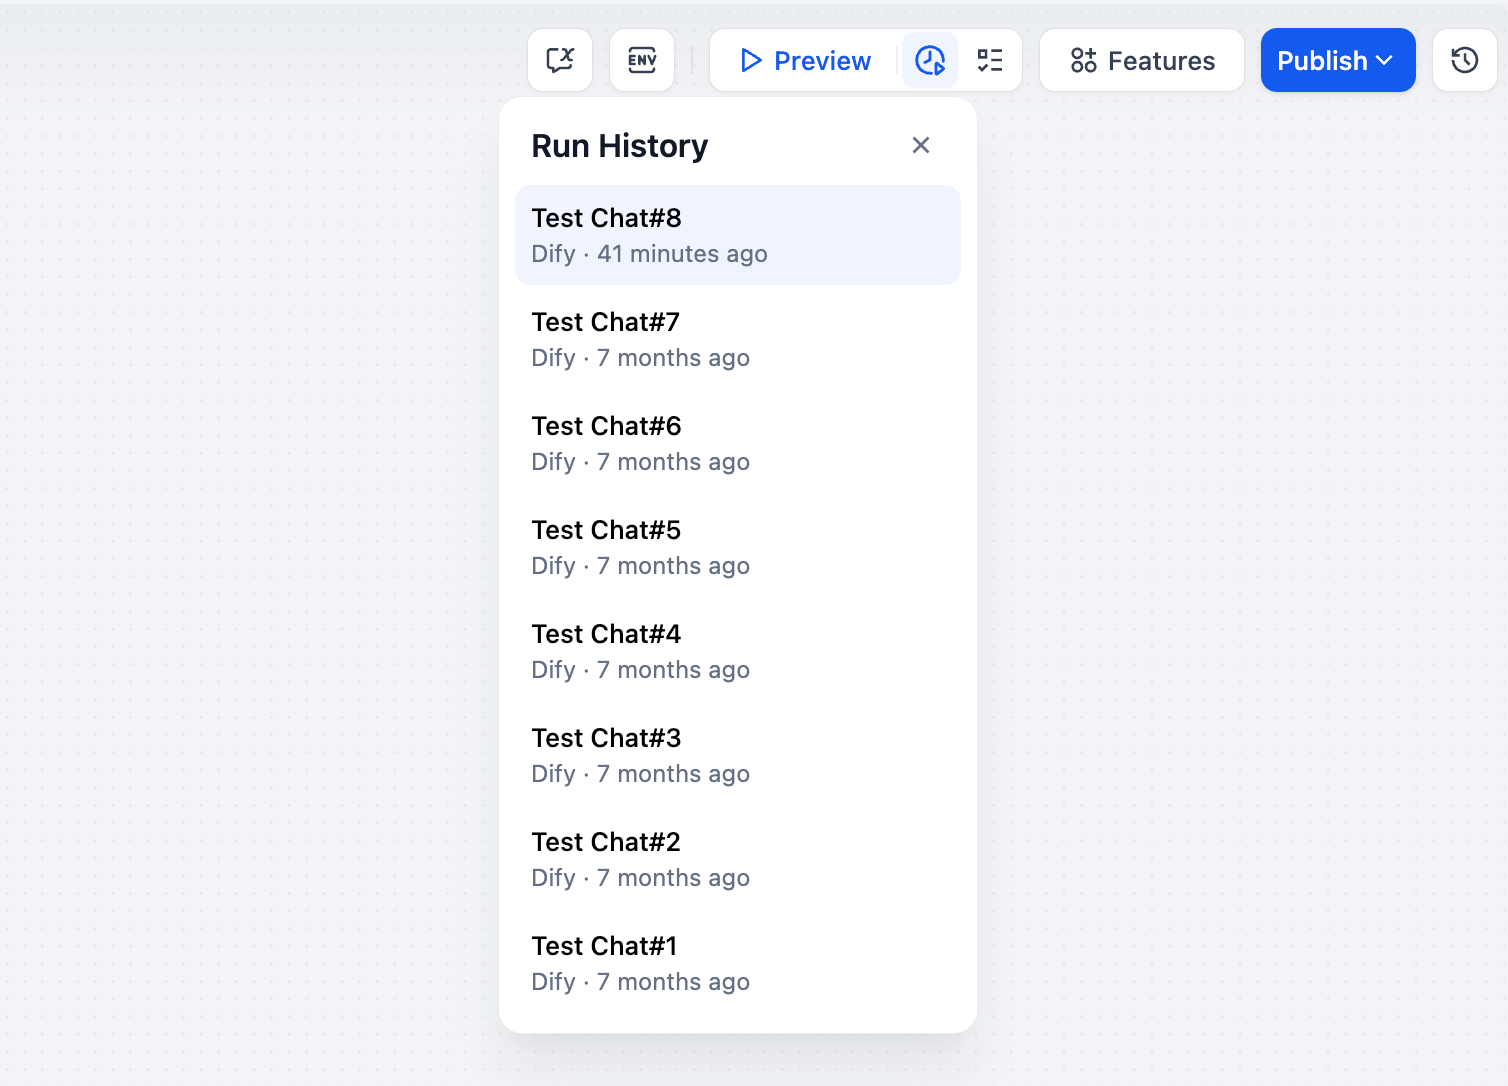
Application Run History
Each time the application runs, a Run History is recorded. Each run is versioned and includes the application’s Conversation Log as well as Tracing Logs for all nodes in that version. These logs are displayed chronologically and provide basic information about each interaction, including execution time, status, and a summary of input/output parameters.
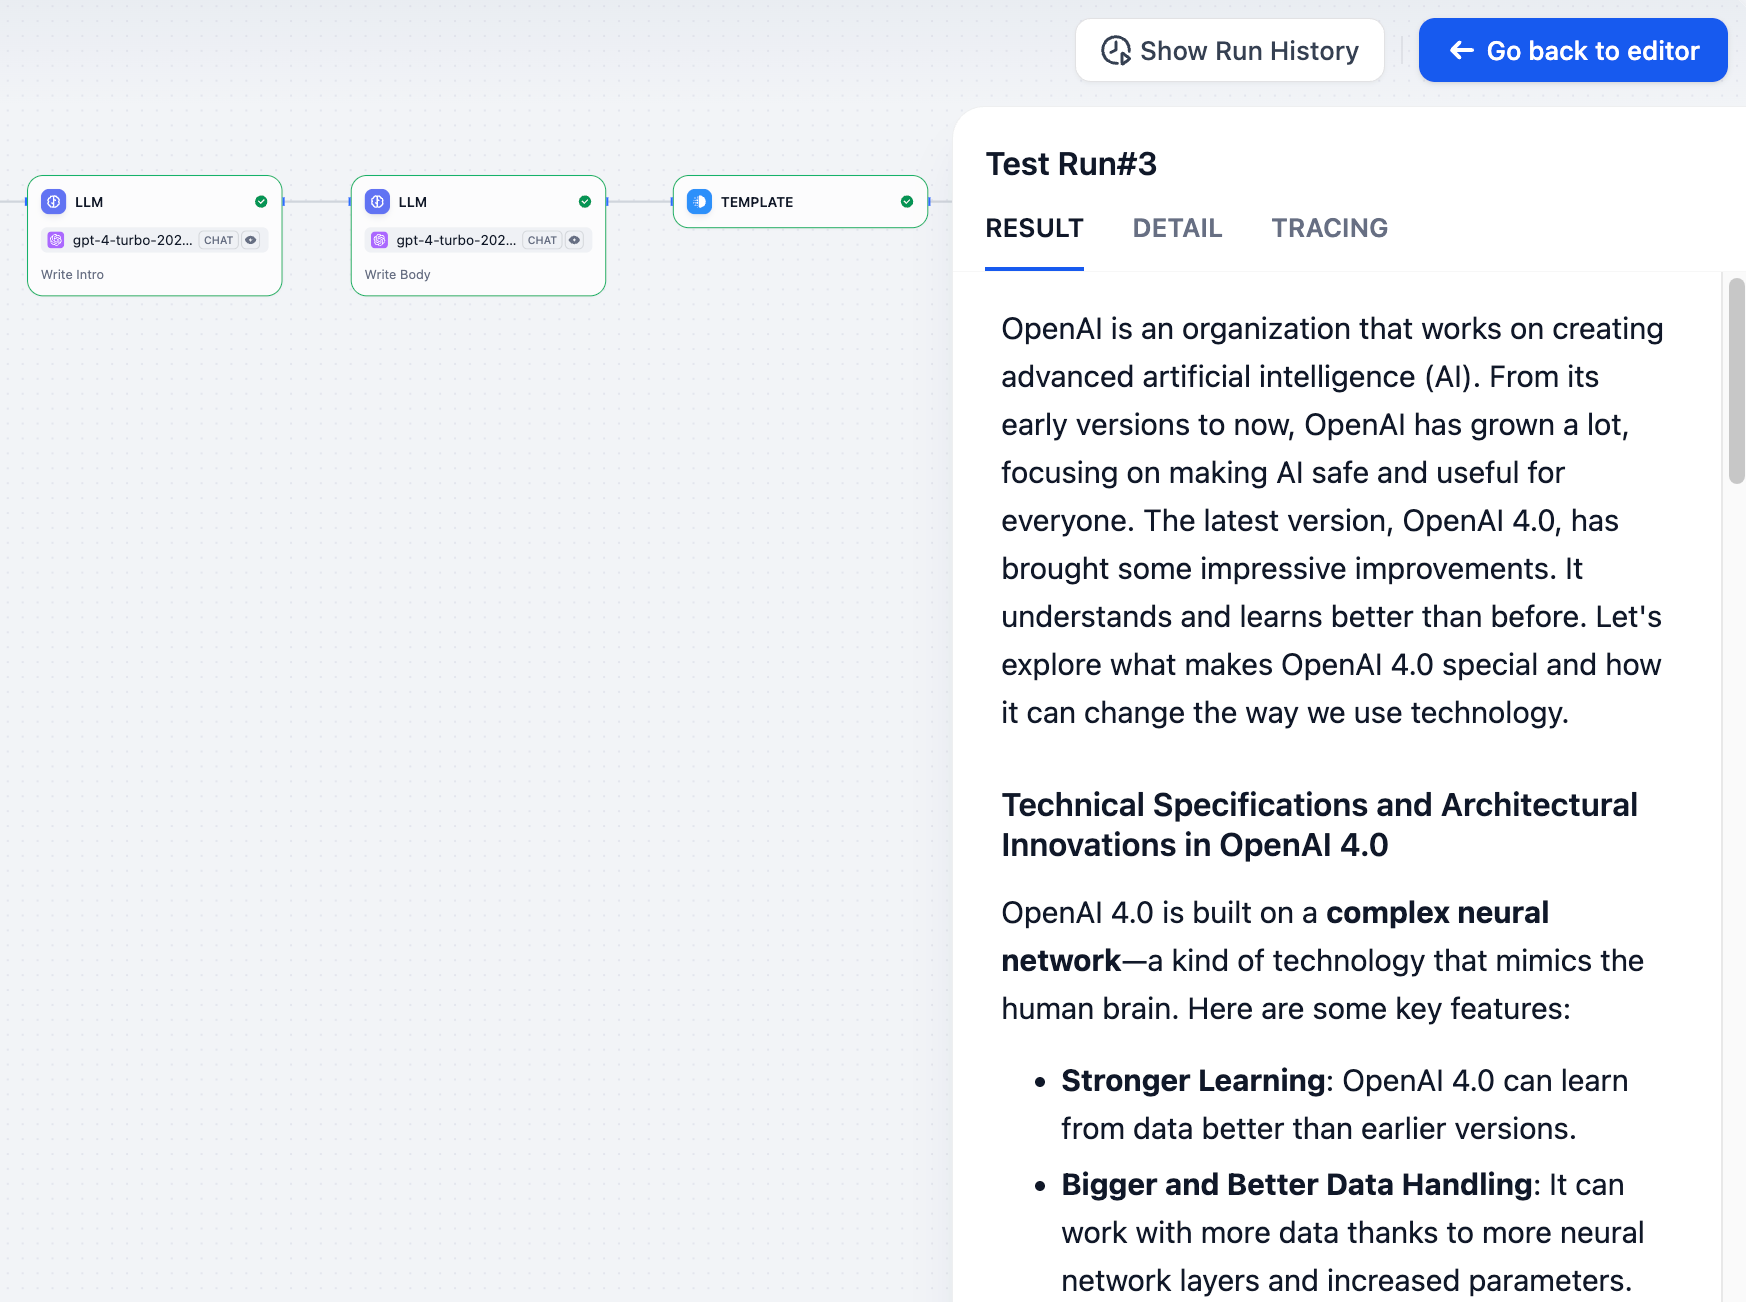
Click on any log entry to see the detailed execution view. Each run includes three major sections:
RESULT
The result section is available only for Workflow applications.
This section displays the final output result of the workflow — the content the user sees. If the workflow failed to execute, this section shows error messages and reasons.
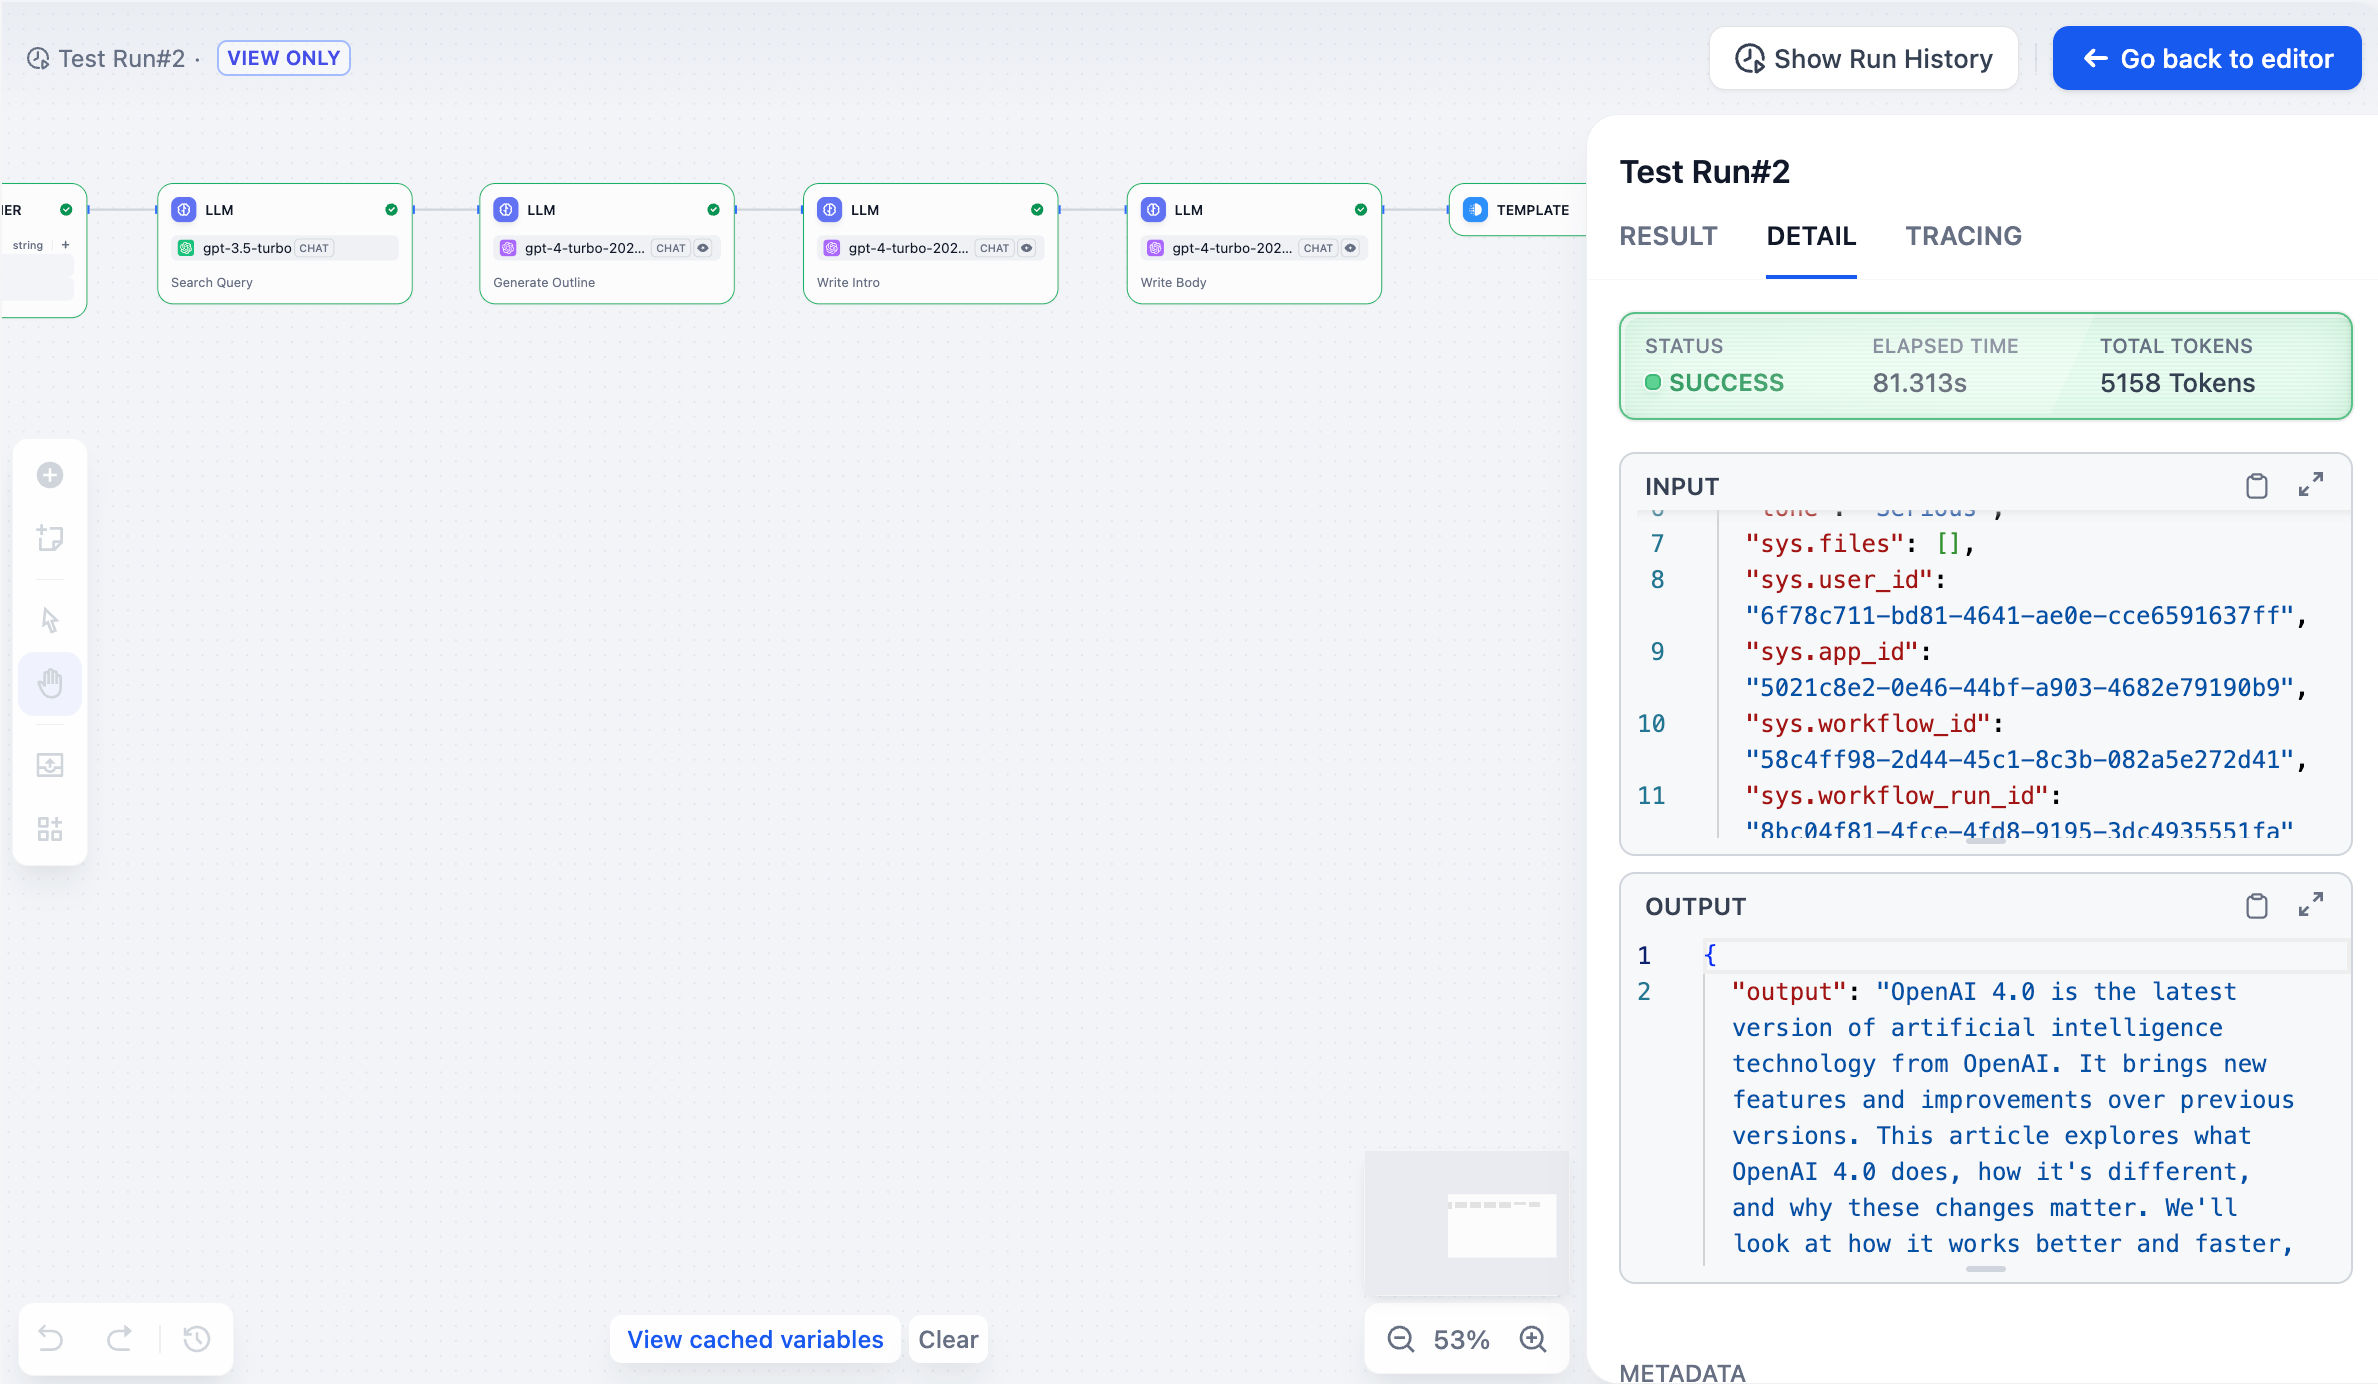
DETAIL
This section includes comprehensive input parameters, metadata, and configuration context from the execution. You can inspect:
- The original input provided by the user
- Output generated by the application
- System-generated metadata
TRACING
This view provides in-depth visibility into the execution path and system behavior. It includes:
- Node execution order: The actual runtime order of each node in the workflow.
- Data flow tracking: How variables are passed and transformed between nodes. This can also be explored via the Variable Inspector.
- Execution time analysis: Time spent on each node helps identify performance bottlenecks.
- Resource usage: Token consumption, API calls, and cost-related data.
- Error tracking: Identify exactly which node failed and why.
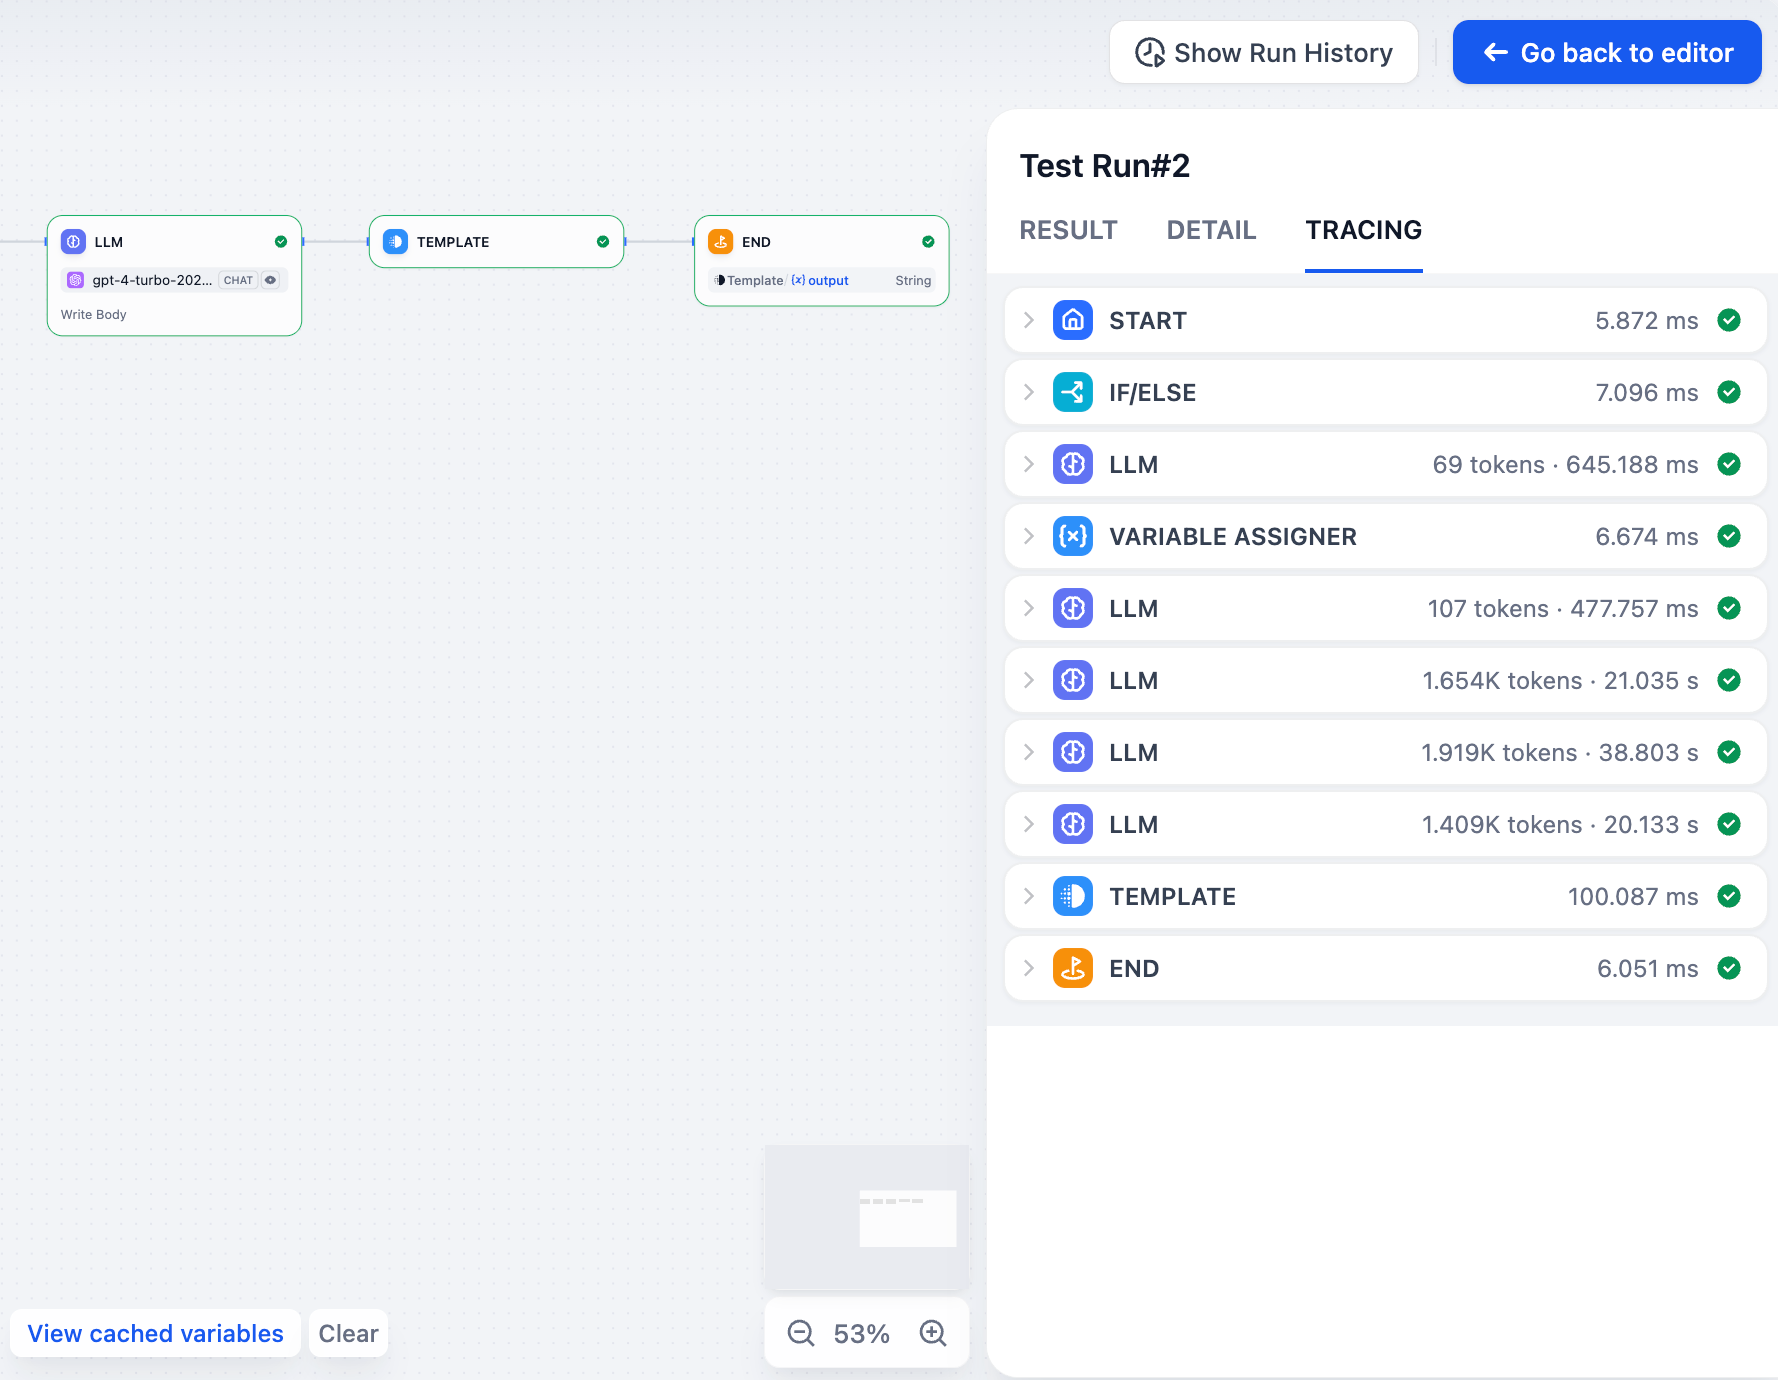
The tracing view is especially useful for debugging complex workflows and optimizing performance. If your workflow includes branches or loops, this view helps reveal the actual path taken during execution.
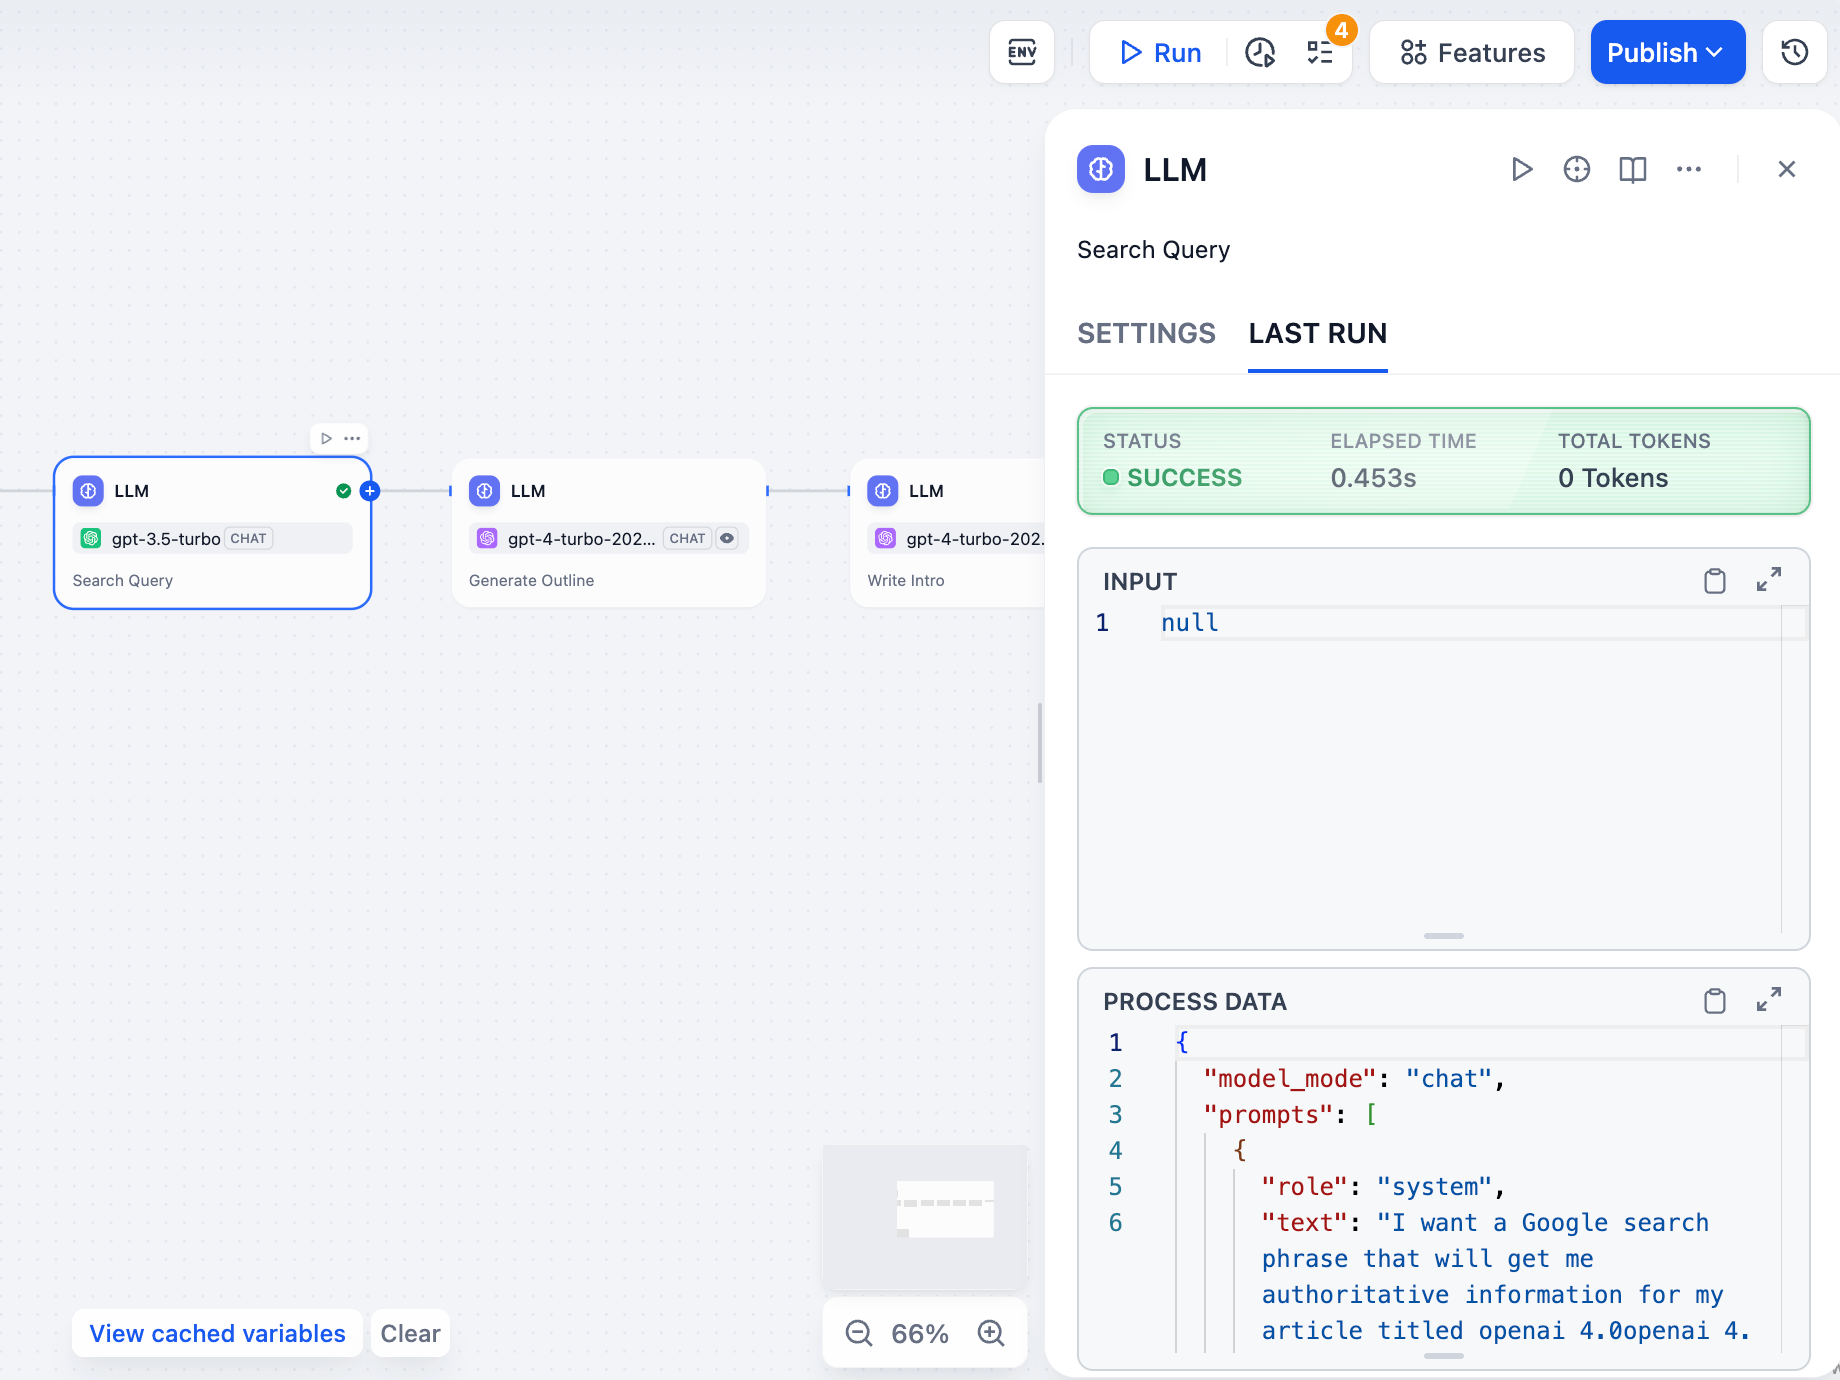
Node Execution Logs
In addition to application-level logs, you can also inspect the last run log for each individual node directly within the workflow editor. Click Last run in the node’s config panel to view its most recent execution details, including input/output data.