

Active Users: Users with meaningful interactions (more than one exchange)
Average User Interactions: Engagement depth per session
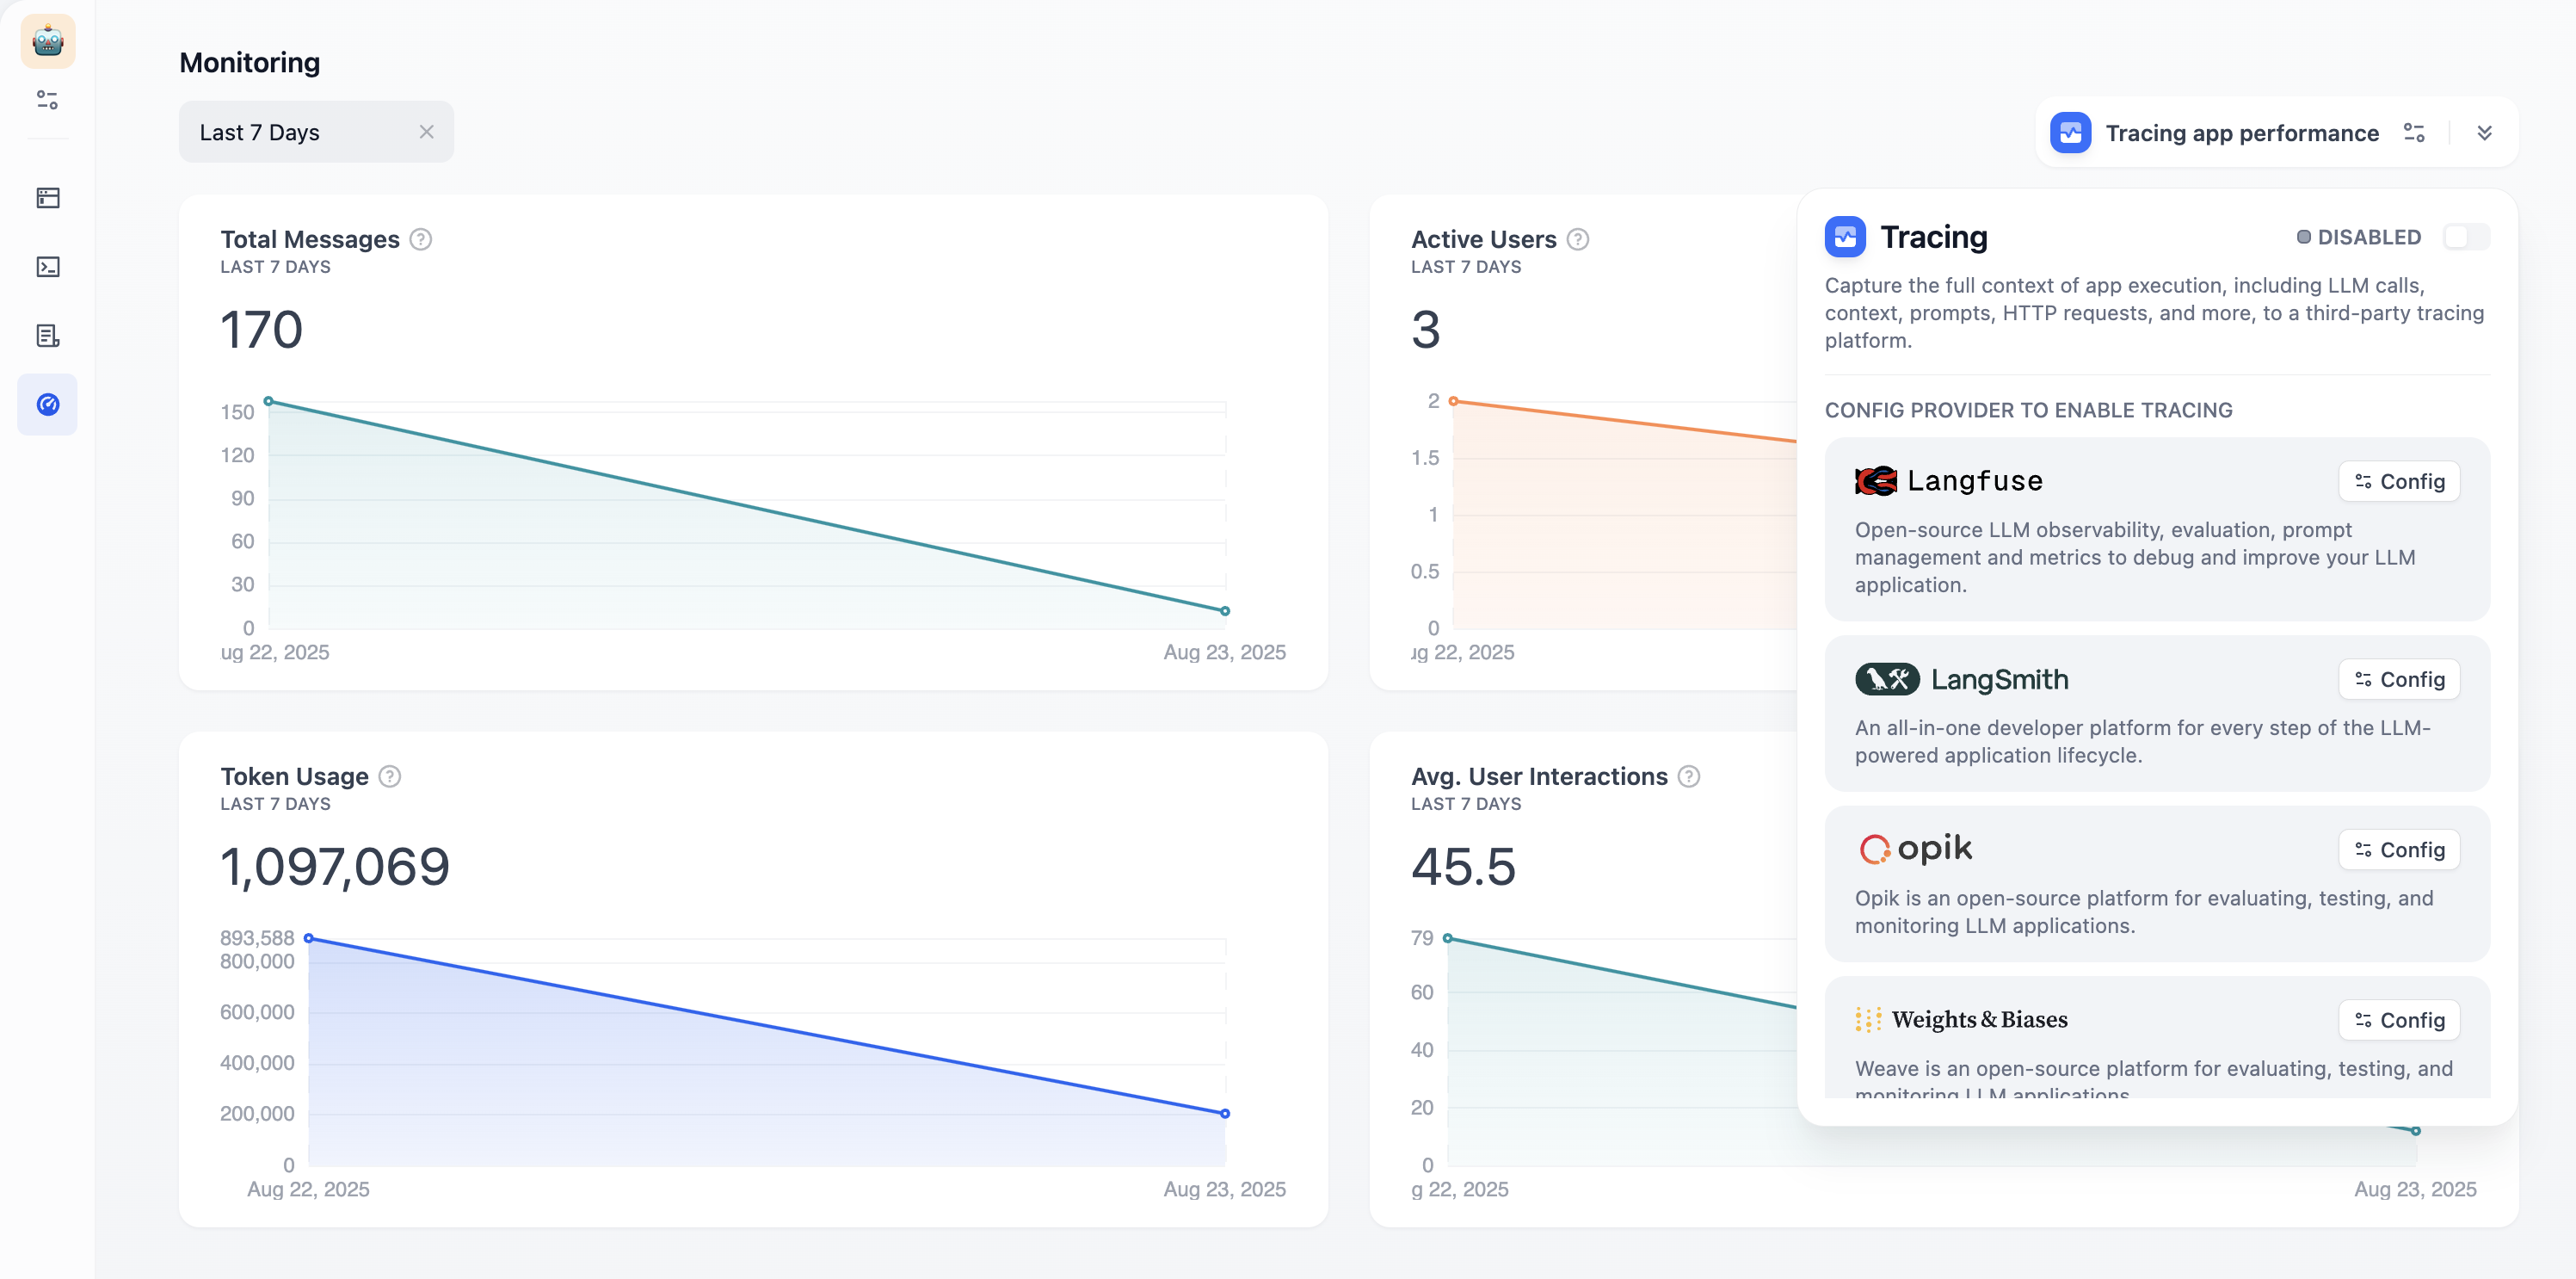
Token Usage: Resource consumption and costs Use the time selector to view trends over different periods. Click “Tracing app performance” to connect external observability platforms like Langfuse or LangSmith for deeper analytics.